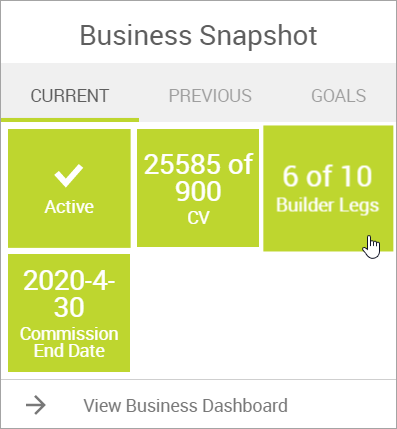
Home > Business Snapshot is a widget that gives Associates a quick view of their most important statistics. These statistics (referred to as Metrics) represent specific data points in the system. You can reference information available on the associate regarding their personal information, rank, volume, tree, etc. Once configured, each data point statistic is displayed as a tile in the widget.
Read more: Setting up the Business Snapshot Widget
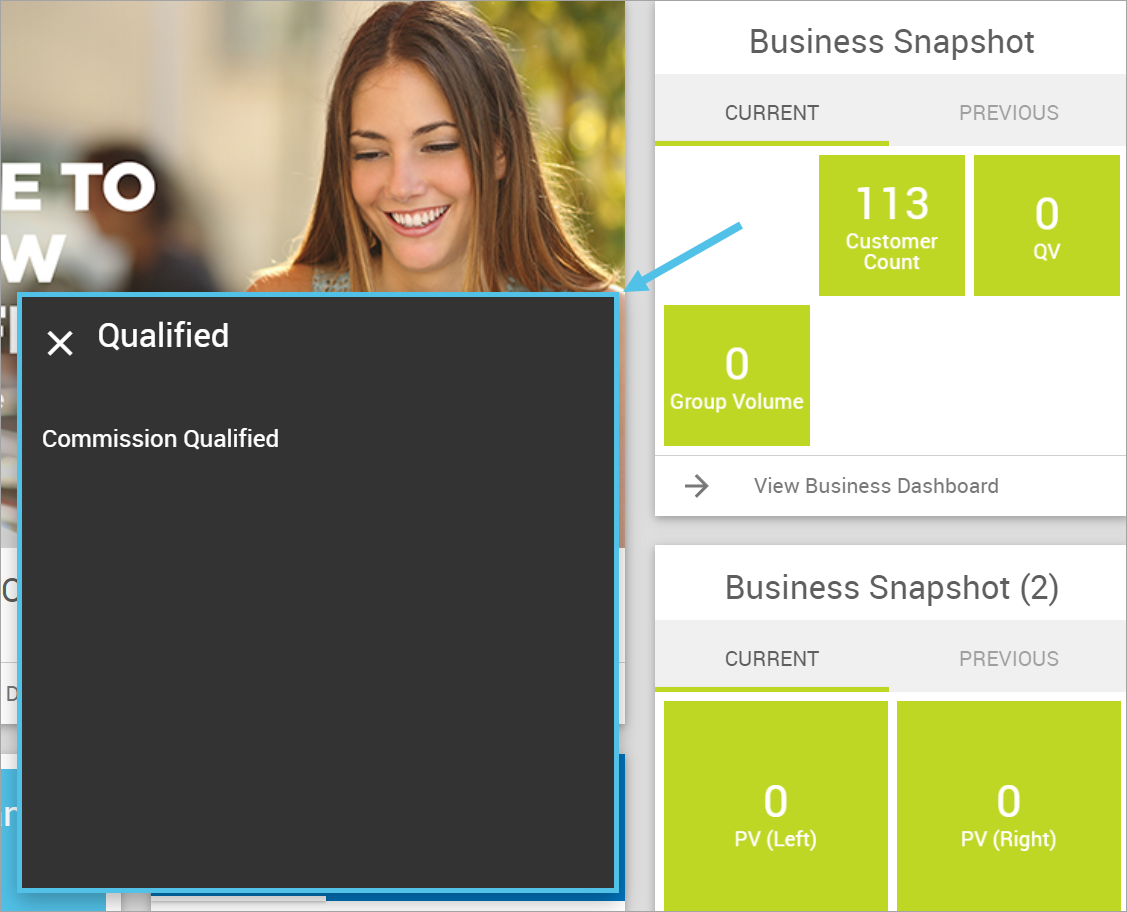
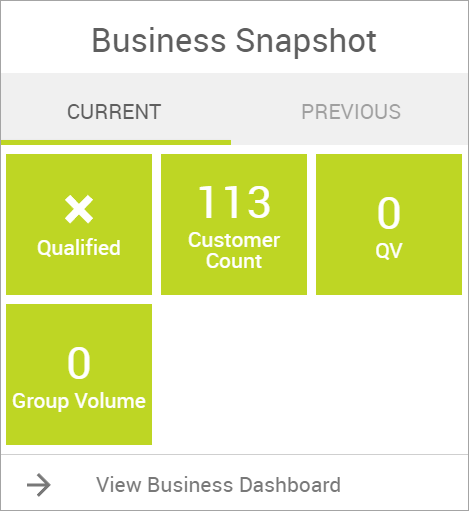
Viewing Data Descriptions
Selecting a tile flips and expands a card that contains a description of the data, as shown in the following images:
Widget Versions
There are two Business Snapshot widgets:
- Home > Tabbed Business Snapshot (3 Columns) - Shows data in 3 columns under tabs that can be customized or removed; you can also add additional tabs. By default, there are CURRENT and PREVIOUS tabs.
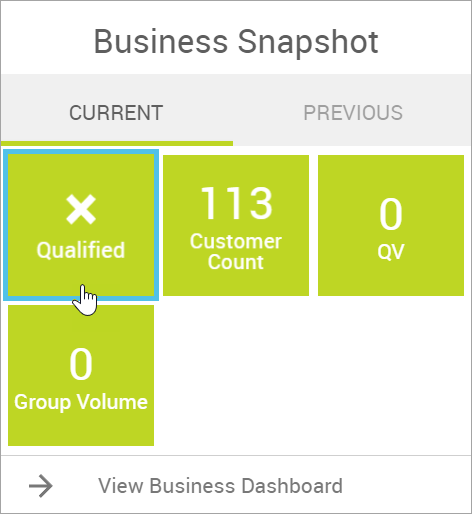
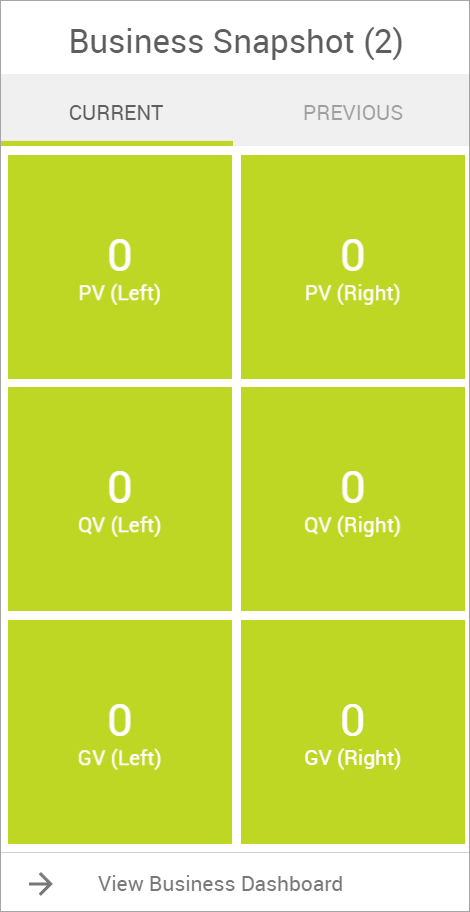
- Home > Tabbed Business Snapshot (2 Columns) - Shows data in 2 columns under tabs that can be customized or removed; you can also add additional tabs. By default, there are CURRENT and PREVIOUS tabs.
| The Home > Business Snapshot (current month only) widget has been deprecated. This widget shows the current month's data only and does not contain tabs. |
Comments
Please sign in to leave a comment.