Admin: Web Office Admin
Page: Web Office Configuration > Business Snapshot
URL: [CLIENTID].admin.directscale.com/#/BusinessSnapshot
Permission: Business Snapshot
Home > Business Snapshot is a widget that provides associates with a quick view of their most important statistics. These statistics (referred to here as Metrics) are representations of specific data points in the system.
You can reference information available on the Associate related to their personal information, Rank, volume, Tree, etc. Once configured, each data point statistic is displayed as a tile in the widget. Before your Associates can use this widget, you must set it up.
Adding Tabs to the Widget
| These steps apply to both the 2 and 3-column Business Snapshot widgets. |
You can organize the Metric tiles under tabs. These tabs can represent anything you want, but you’ll typically want one each for current and previous commission periods.
-
On the Business Snapshot page, click TABS for the widget you want to configure (3 Columns or 2 Columns).
-
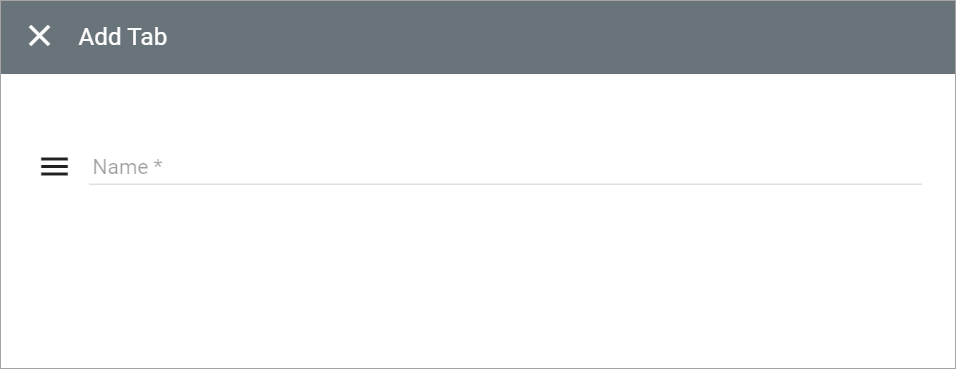
Click ADD TAB to open the Add Tab pop-up window.

-
Enter a Name for the tab.
-
Click SAVE.
| The tab won’t display in the Business Snapshot widget until you add metrics to it. |
Adding Metrics to a Tile
| These steps apply to both the 2 and 3-column Business Snapshot widgets. |
-
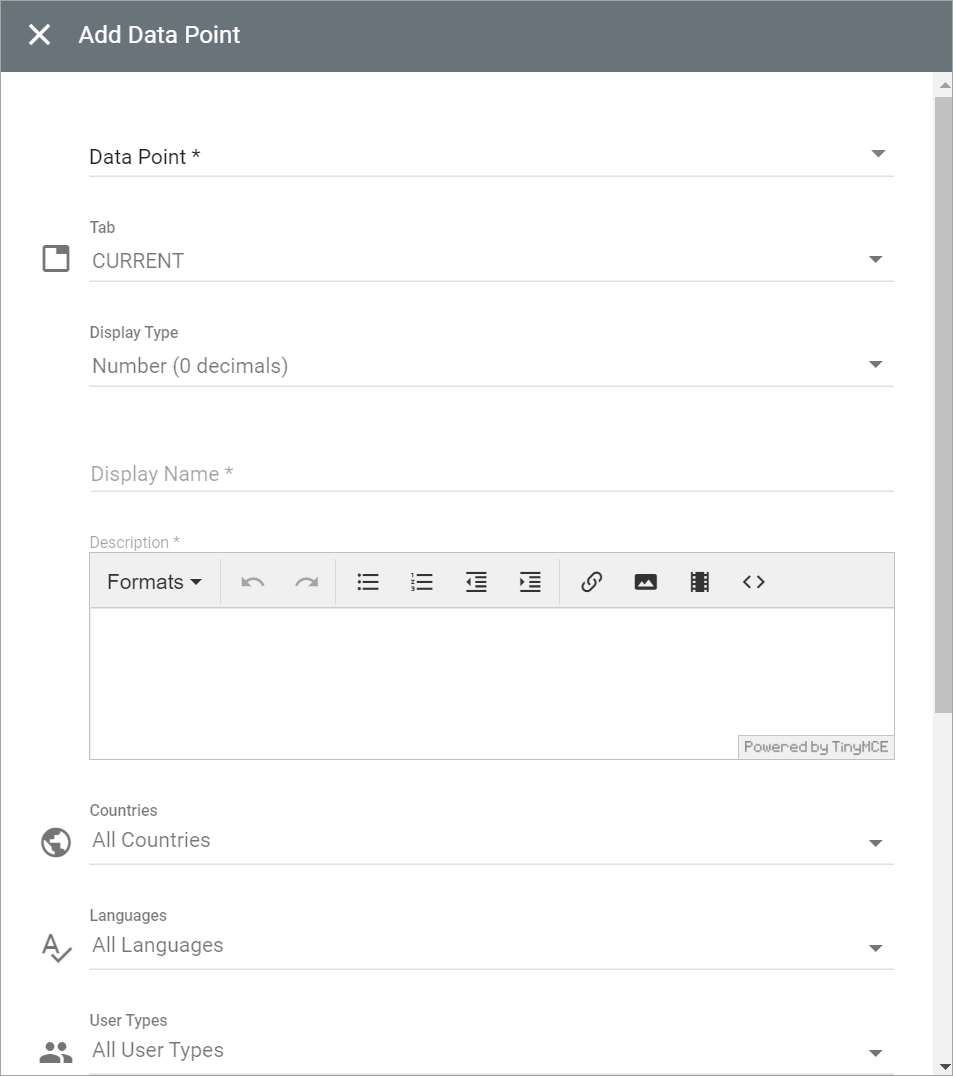
Select the METRICS tab for the widget you want to configure (3 Columns or 2 Columns). Then, click the ADD METRIC button to open the Add Data Point pop-up window.

-
In the pop-up, click the Data Point drop-down menu, and select the data point you want to display in the widget.
The time frame fields will reveal if the chosen data point has a period constraint. -
Optionally, click the Tab drop-down menu to select the tab where the metric will appear in the widget.
This option will only display if there are multiple tabs available. -
If the Time Frame fields are visible, click the EDIT button to select either Months or Weeks in the Time frame drop-down menu.
-
Next, select either Current, Last, or _ months/weeks ago.
-
Enter the Display Name that will appear under the data in the widget tile.
-
Enter a description of the metric’s purpose in the Description TinyMCE Text Editor.
Selecting Display Types
-
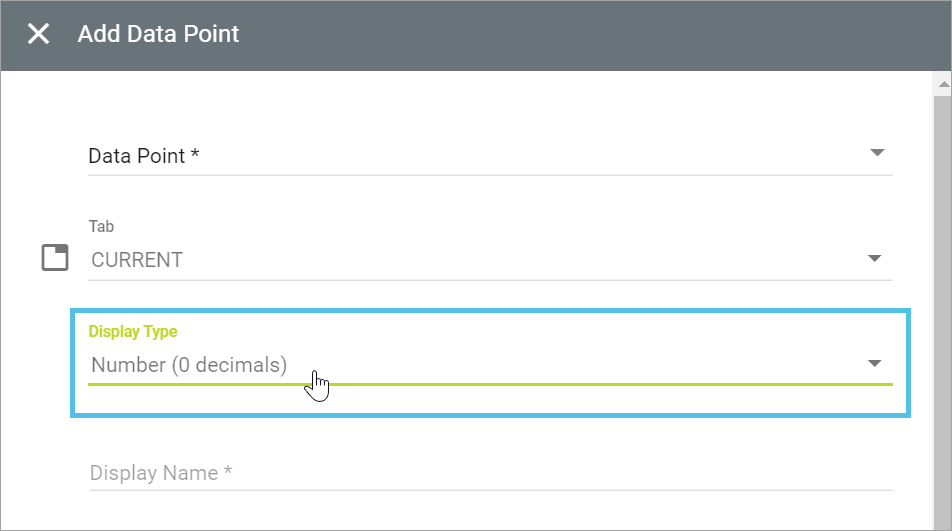
Click the Display Type drop-down menu, and select in what format the data will display.

Display Types define how the Metric will appear in the Web Office widget tile.
If you, for example, chose the Commission Active data point (which is either active or inactive), and then selected a Number (0 decimals) display type, then the tile will display either a 1 or 0 (the numerical representation of true/false). Boolean would be a more appropriate choice.
If you select the wrong display type, the tile will display the data point’s value. For most data points, this will appear just fine in the tile. If you don’t like how a data point displays, try different display types until one works for you.
Display Types:
-
Boolean - True or false. A checkmark will display in the widget tile if the Associate meets the criteria. If not, then an displays.
-
Date - If you select a date data point, this type will display your system's date format.
-
Number (0 decimals) - Displays numerical data with no decimals (0).
-
Number (1 decimal) - Displays numerical data with one decimal point (0.0).
-
Number (2 decimals) - Displays numerical data with two decimal points (0.00).
-
Custom - For more information, see Custom String Format.
-
Value to text… - This type allows you to replace the default data point with your own text value. This works best with Ranks or statuses. For example, with ranks, the system will display a 1, 2, 3, etc. In the Metrics Value field, you can enter the value the system sends. Then, in the Display Values field, you can enter what you want to display in the tile.
For example, Commission Active displays either 1 or 0 by default. You can change each to Yes or No or any other Display Value you want.
Saving the Configuration
-
Click the Published toggle to publish the metric now after you save the configuration.
Alternatively, you can publish the metric from the Metrics List by clicking the Publish icon.
-
The rest of the settings are Multi-Faceted Configurations (MFC). You can enter your specific configurations on who can view the metric.
-
When finished, click SAVE.
The metric will display as a tile under its tab in the Business Snapshot widget in the Web Office.
Comments
Please sign in to leave a comment.