Admin: Web Office Admin
Page: Web Office Configuration > Visual Tree
URL: [CLIENTID].admin.directscale.com/#/VisualTree
Permission: Visual Tree
The Web Office Admin allows you to customize Visual Tree features such as the icons the Associate sees, the Trees they view, and the data points shown.
Adding Data Points
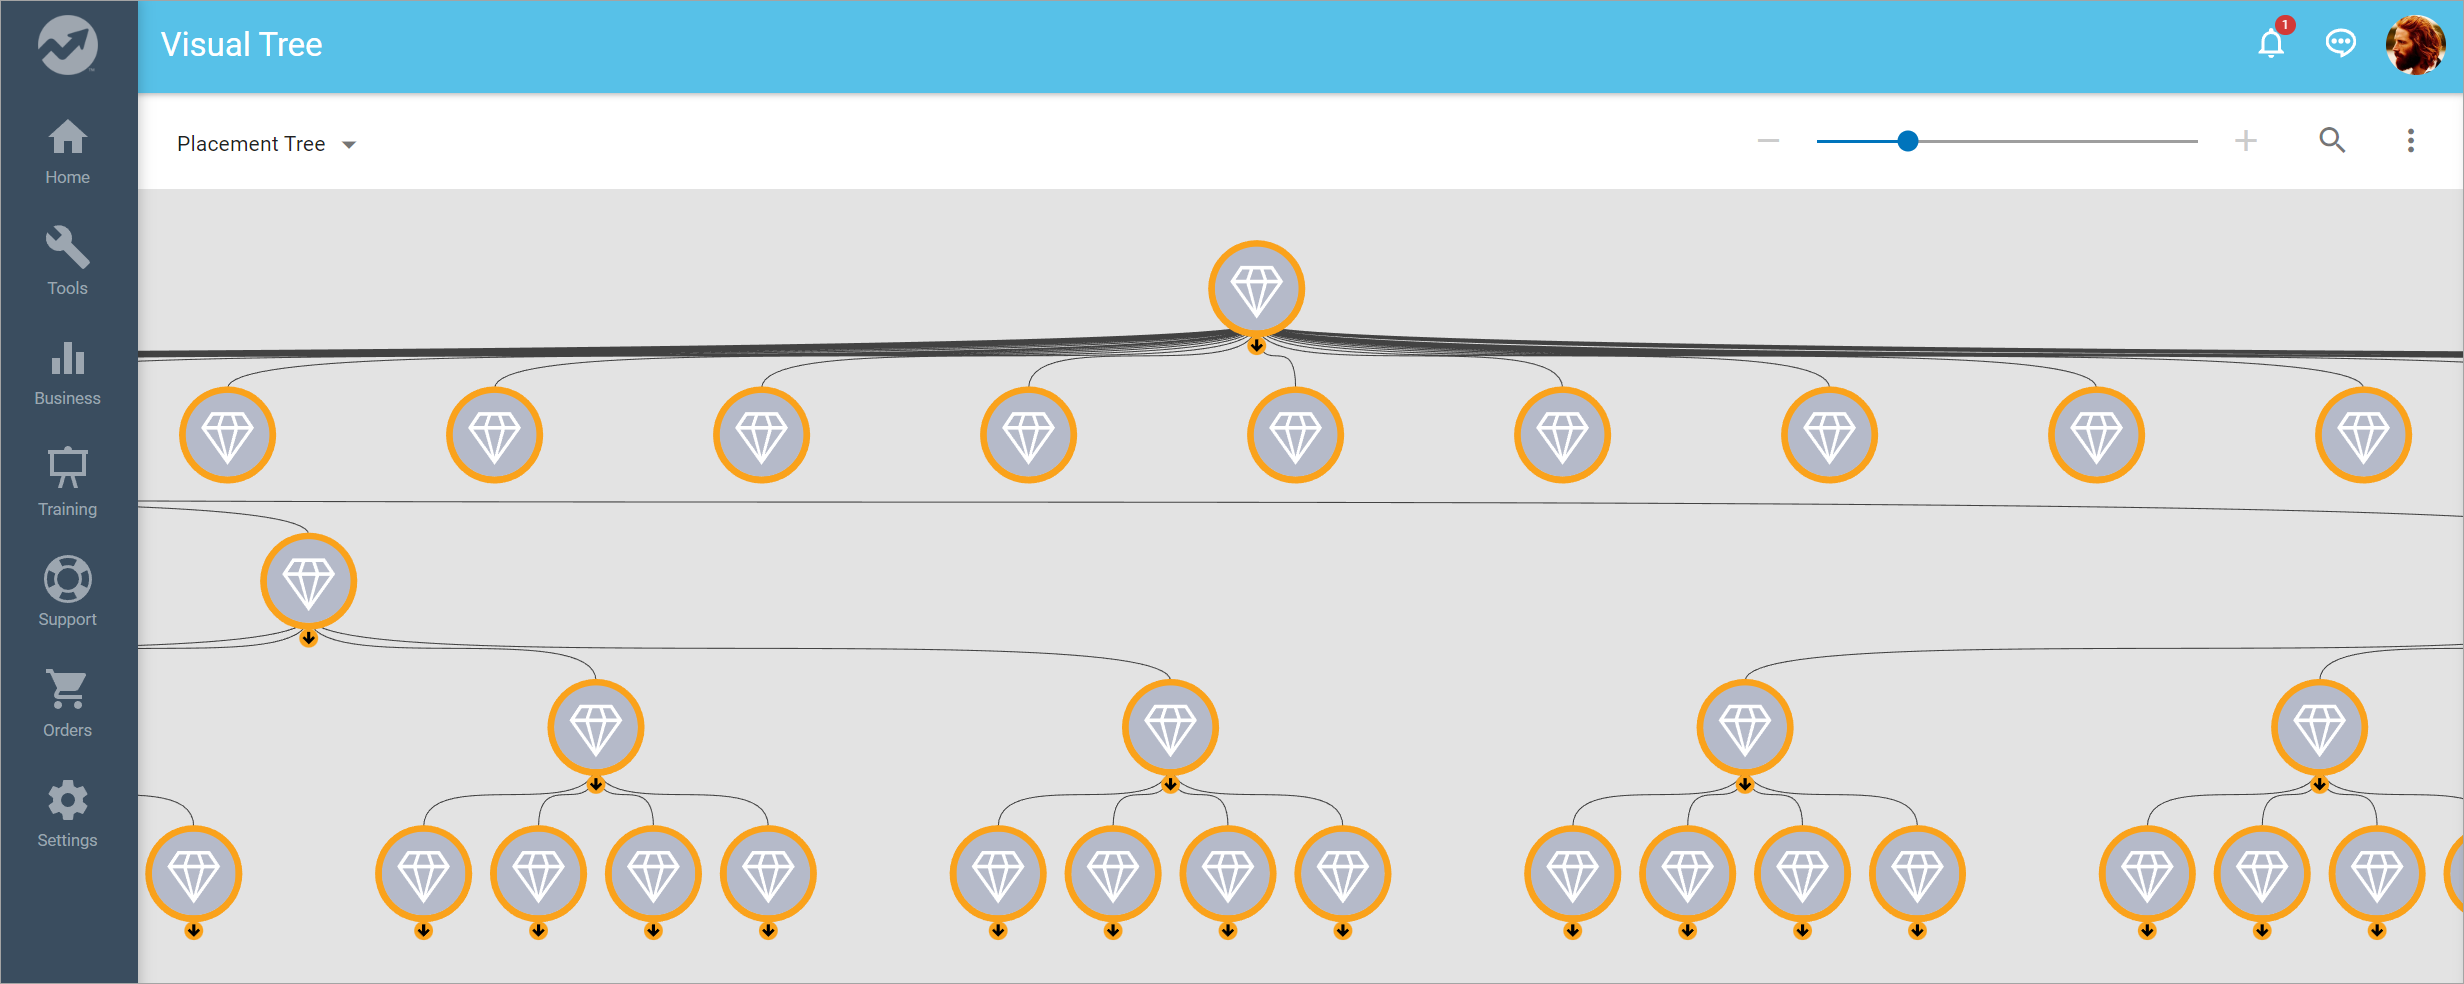
Profile data points will display in the Visual Tree on the profile quick view. This quick view is available by clicking on any card within the Tree.
To add data points:
-
Click the ADD METRIC button.
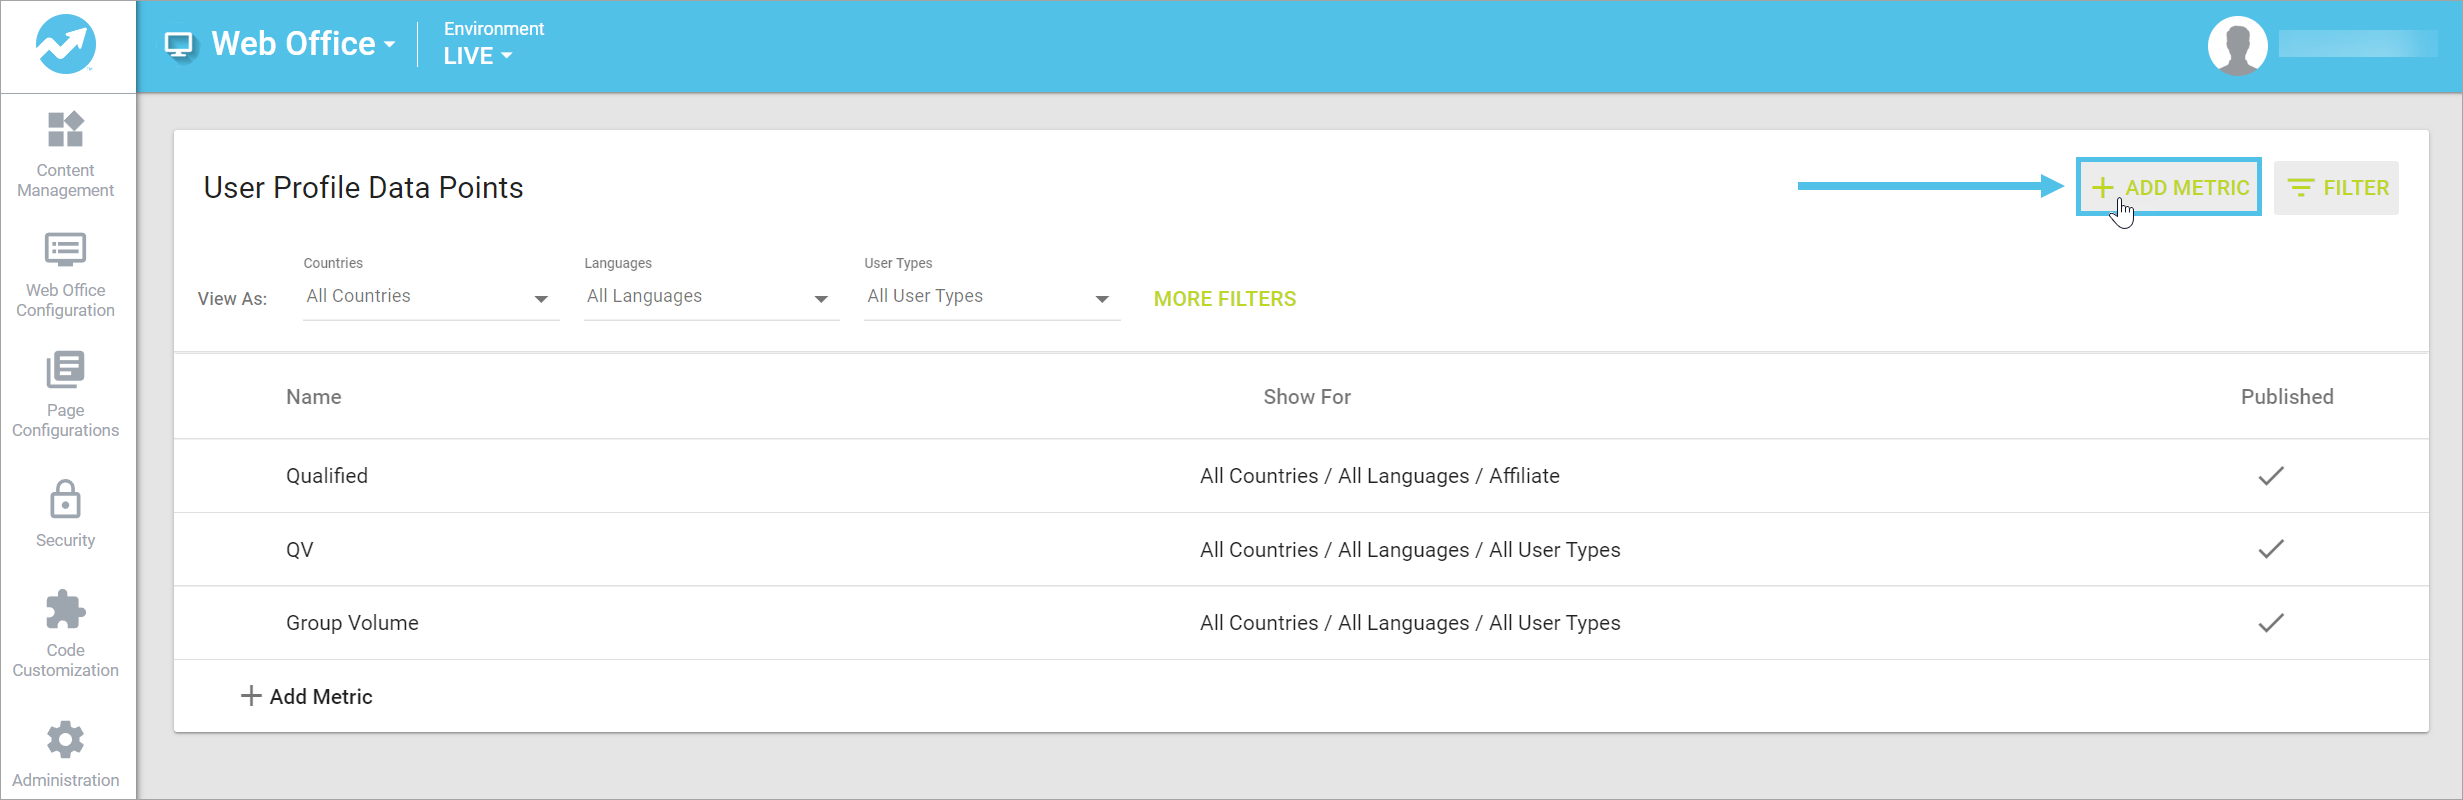
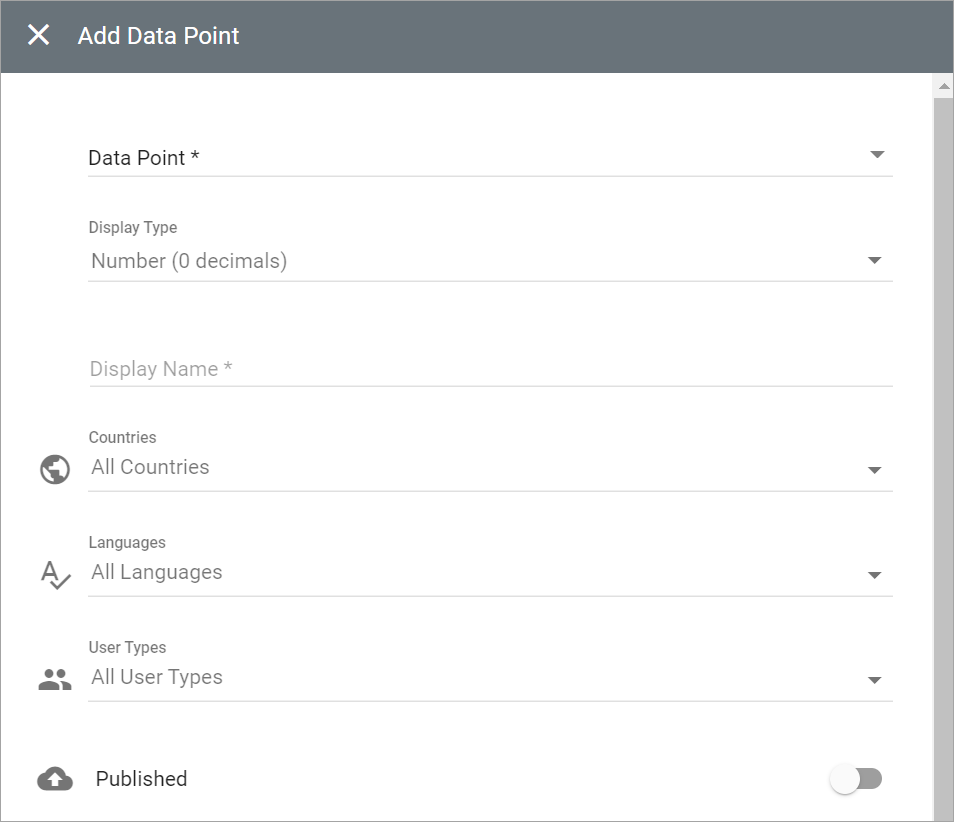
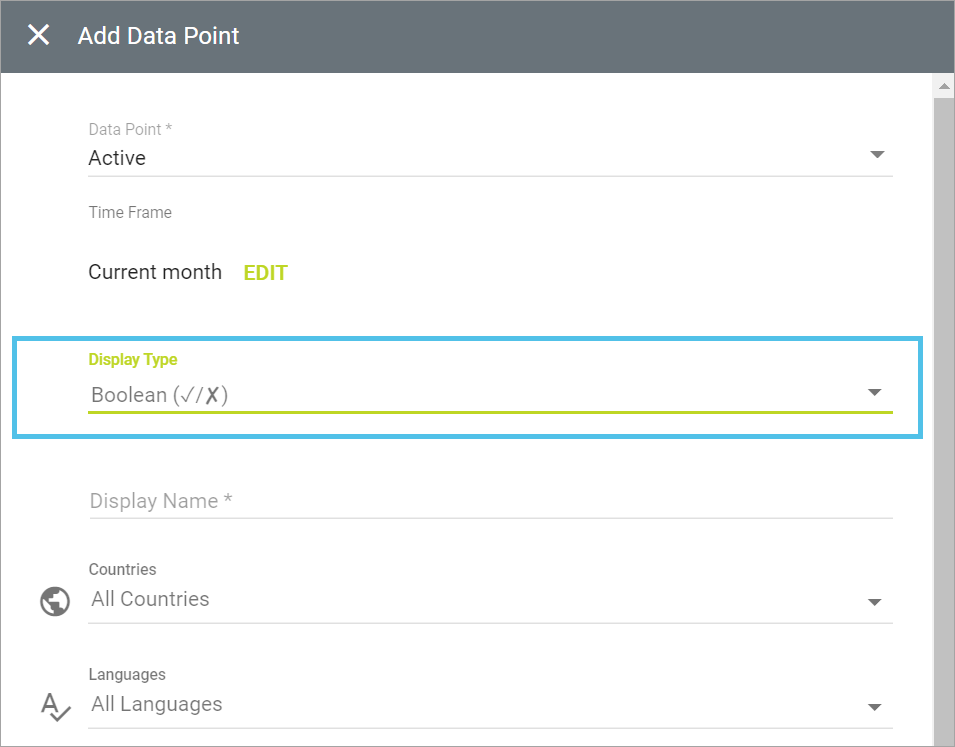
The Add Data Point pop-up window opens.
-
In the pop-up, click the Data Point drop-down, and select the data point you want to display in the widget.
The Time Frame fields will reveal if the chosen data point has a period constraint. -
If you select a data point related to a specific period, then the Time Frame fields appear to allow you to change the time frame covered to Months or Weeks.
Selecting Display Types
Select the most appropriate type in the Display Type drop-down based on your Data Point selection.
Suppose you chose the Commission Active data point (active or inactive) and selected a Number (0 decimals) display type. Then, the tile will display either a 1 or 0 (the numerical representation of true/false). Boolean would be a more appropriate choice.
If you choose the wrong display type, the tile displays the data point value. For most data points, this will appear just fine in the tile. If you do not like how a data point displays, try a different display type until one works for you.
Display Types:
-
Boolean - True or false. If the Associate meets the criteria, a will display in the widget tile. If not, an is displayed.
-
Date - If you select a date data point, this type will display your system’s date format.
-
Number (0 decimals) - Displays numerical data with no decimals (0).
-
Number (1 decimal) - Displays numerical data with one decimal point (0.0).
-
Number (2 decimals) - Displays numerical data with two decimal points (0.00).
-
Custom - For more information, see Custom String Format.
-
Value to text… - This type lets you replace what the data point displays by default with your text value; this works best with ranks or statuses. For example, with Ranks, the system will display a 1, 2, 3, etc. In the Metrics Value field, you can enter the value the system sends. Then, in the Display Values field, you can enter what you want to display in the tile.
For example, Commission Active displays either 1 or 0 by default. You can change each to Yes or No or any other Display Value you want.
Saving the Data Point
-
Enter any Display Name for the metric that is indicative of its purpose.
-
Click the Published toggle to the on position to publish the metric.

-
The rest of the settings are Multi-Faceted Configurations (MFC).
These settings allow you to tailor your content based on an Associate’s country, language, user type, status, and rank.
-
SAVE the configuration.
Tree Settings
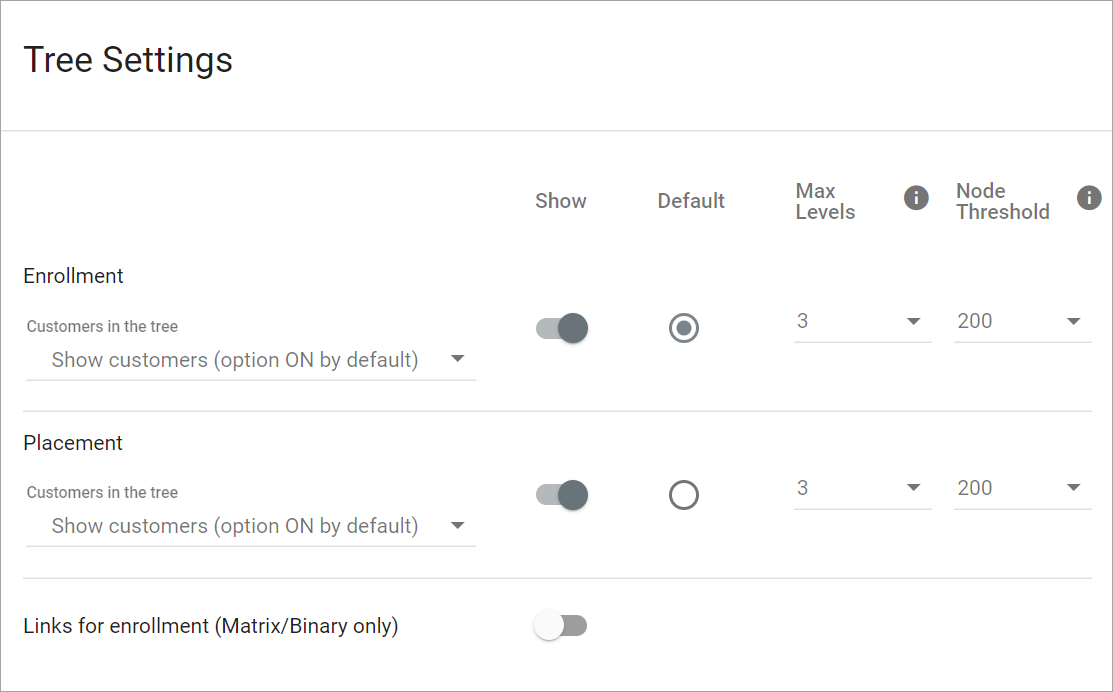
In the Tree Settings section, you can enable any available Tree to show in the Visual Tree.
You can enable or "show" any available Visual Tree(s) by marking the Show toggle for the various Tree types.
Associates in the Web Office may view the Visual Tree(s) selected. You can also choose which Tree will show by default upon page load.
If available, you can choose whether to show customers in the Tree(s); this would set the default setting upon page load.
Enabling/Disabling in Web Office
Site: Web Office
Page: Business > Visual Tree
URL: [CLIENTID].office2.directscale.com/app.html#/VisualTree
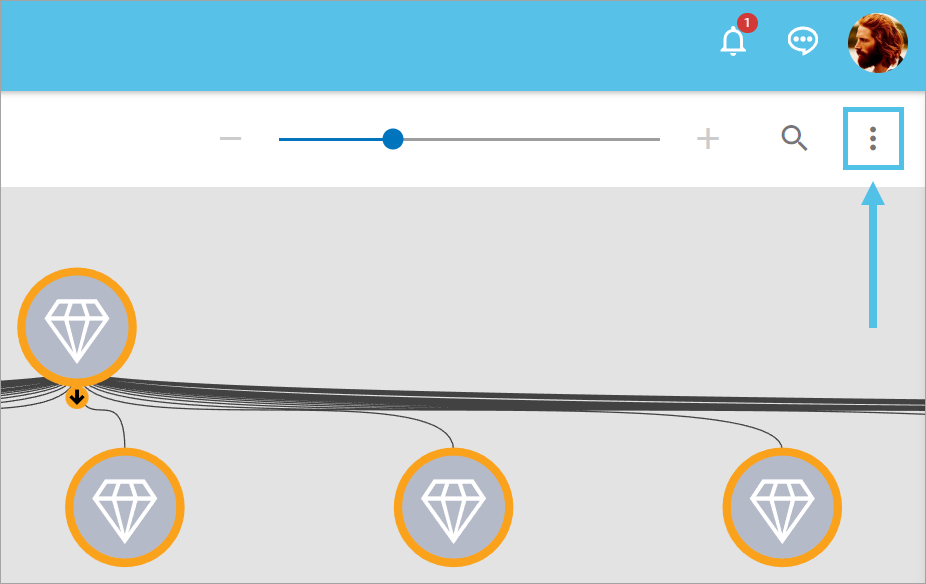
Associates can turn this on and off within the Web Office:
-
Click the menu next to the Zoom Slider.
-
Select the Show Customers checkbox.
Along with these configurations, you can:
-
Control how many levels are visible when the page is loaded in the Max Levels drop-down
-
Decide how many Associates an Associate can see in each level with the Node Threshold drop-down.
You may have multiple Trees available. The Tree types are pulled from Corporate Admin.
If the Matrix field is available, you can choose to show customers in the Tree(s); this would set this as the default Tree when the page loads. Associates can turn this on and off within the Web Office.
Setting Matrix Tree Depth Level in Corporate Admin
Admin: Corporate Admin
Page: Administration > Advanced Settings > Commission
URL: [CLIENTID].corpadmin.directscale.com/Settings?category=Commission
Permission: ViewAdministration(), ViewAdvancedSettings()
In Corporate Admin, you can configure the level depth that the Matrix Tree will display in the Web Office.
To configure the Matrix Tree depth:
-
Locate the Tree Settings section.
-
Enter the Matrix Depth Level limit.
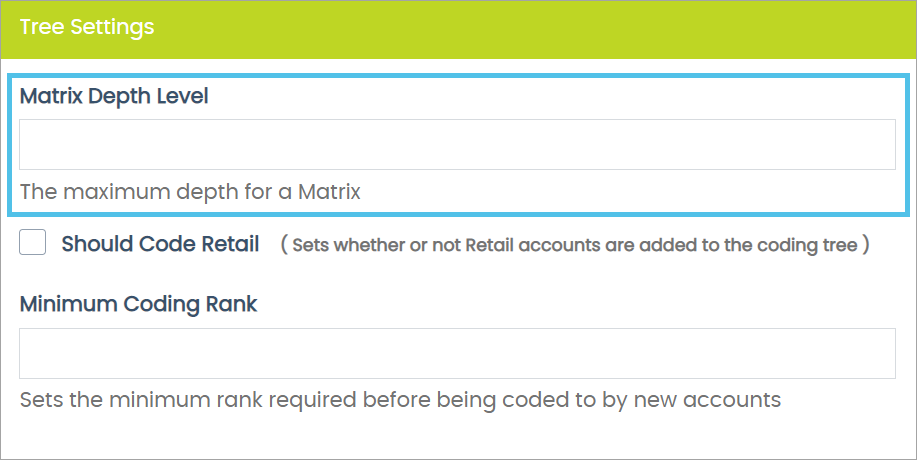
The Visual Tree will stop showing Associates below this entry.
-
Click the Save Changes button.
Links for Enrollment (Matrix/Binary only)
Admin: Web Office Admin
Page: Web Office Configuration > Visual Tree
URL: [CLIENTID].admin.directscale.com/#/VisualTree
Permission: Visual Tree
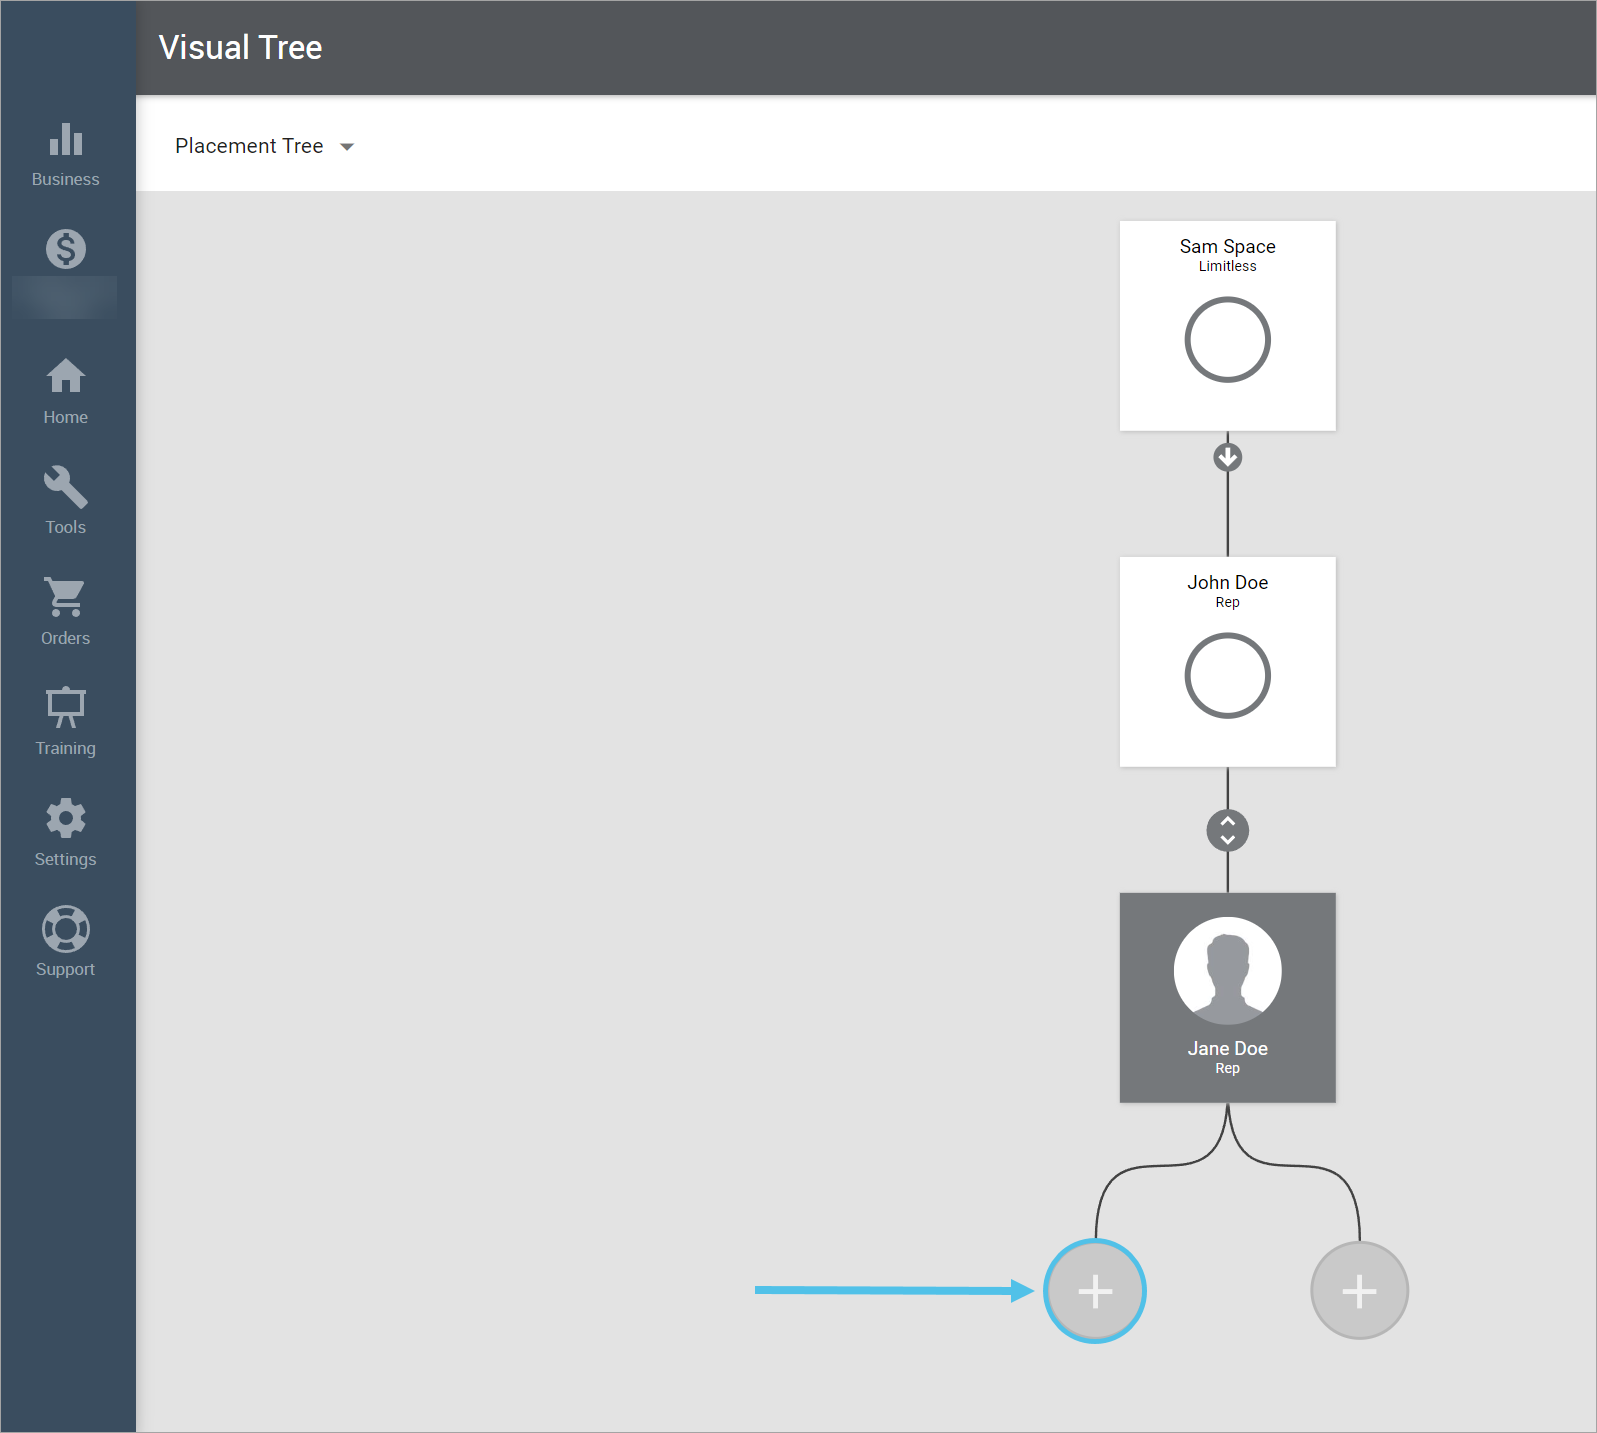
Turning this feature on will enable enrollment options directly from the Visual Tree. When there is an open position on the left or right Leg in a Matrix/Binary Tree, an Associate can select to enroll a new Associate directly in that position.
When you expand the Tree, you can find the open positions.
Select the button from the Visual Tree when a position is open; this will load the enrollment flow in a new tab.
There are additional configurations to complete to ensure the correct IDs pass in the URL for enrollment.
To activate Links for enrollment:
- Locate the Tree Settings section.
- Click the Links for enrollment toggle to the on position to enable the feature.

- Enter the Placement URL Template. The URL may include the following variables:
- Enroller ID = {enrollerId}
- Who the new enrollee is placed under in the Enrollment Tree (who referred them)
- Sponsor ID = {sponsorId}
- Who the new enrollee is placed under in the Binary/Matrix Tree
- Leg Name = {legName}
- Which leg to put them on
- Language Code = {languageCode}
- Passes in the logged-in user’s language
- Country Code = {countryCode}
- Passes in the logged-in user’s country
- Web Alias = {webAlias}
- Passes in the logged-in user’s web alias
Example URL:
domain.com/{webAlias}?type=1&enrollerId={enrollerId}&sponsorId={sponsorId}&legName={legName}&language={languageCode}&countrycode={countryCode}Consult with your shopping/enrollment website provider to know what URL structure you should use. - Enroller ID = {enrollerId}
- Click the Save button when complete.
Custom Color Label
The Custom Color Label is based on true/false criteria displayed as a data point in the Visual Tree, along with the User Profile Data Points.
A DirectScale developer currently codes this.
Although the developer creates the logic behind the feature, you can change the display name shown to the Associate.
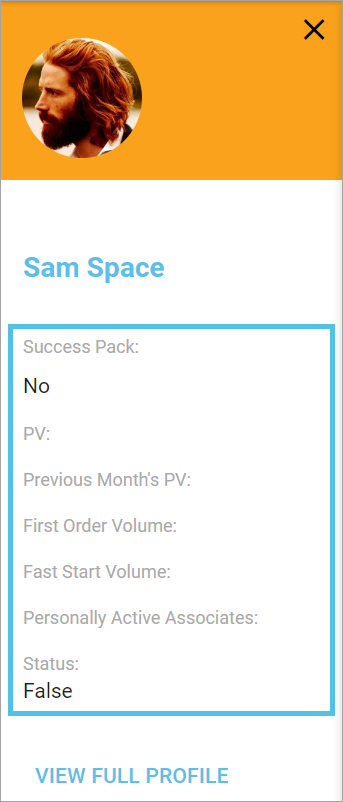
For example, a company named Success Co. has a program where Associates can qualify to go on a vacation. To qualify, Associates must purchase a Success Pack.
In the Visual Tree, there is a section on the Data Point slide-out labeled Success Pack Qualified. If they have purchased the pack, the data point will read display Yes.
If the Associate has not purchased the pack, the data point will display No.
-
Enter the Custom Color Label.
-
Click the Save button when complete.
Active Statuses

Active Statuses control who will show as Active in the Visual Tree.
The statuses left un-selected will grey out and display the status reflected in the Corporate Admin.
In the Visual Tree, the tiles will display an Associate’s status; this is identified by color and through text on the tile.
-
Click the Statuses drop-down and select the statuses.
-
Click the Save button when complete.
Adding Visual Tree Icons
To add the icons for the Visual Tree, you will need to navigate to a different page in Web Office Admin, the Branding page.
Read more: Adding Visual Tree Icons.
Comments
The "Custom Color Label" no longer requires custom code.
There is now a Corp Admin advanced setting under the "Commission" category (Visual Tree) called "Visual Tree Indicator Stat". Type in the Stat key (found using the GetAssociateDataPoints call, or talk to your local Support agent) in the field and Save, and you'll see the Visual Tree label and color update accordingly.
The stat needs to be a boolean (true/false). The color will engage when the value is "true" (or 1).
Please sign in to leave a comment.